Data analytics might sound complicated, but it can be pretty simple(opens in a new tab), and there are a lot of tools that you can use to make it easy. In this article, I’ll explain to you the basics of how tour operators can, and should, use data analytics. All Tourism Tiger websites(opens in a new tab) come with access to Google Analytics, so it is important to learn what you’re looking at.
Let’s start with what you should be measuring.
Be selective. There is a lot of data that you could analyze, but there’s also a lot that you shouldn’t. Most importantly, you need to understand what your business goals are in order to be sure of what you should focus on.
I don’t want to tell you how to do your job, but as a tour operator, your number one goal should be to sell tours. So, your social media accounts should be used to fulfill this aim.
Don’t bother concentrating on vanity data, such as post likes and impressions. Measuring and analyzing vanity data might make you feel good, but it won’t help your business.
While people often believe that engagement on social media (comments and likes) is a good metric to study, it unfortunately has no proven correlation to business success metrics, such as loyalty and sales, so don’t stress too much if your engagement is lower than you want.
Of course, it’s fun to measure impressions and likes, but you want to focus on how this translates into sold tours. To work towards this goal, track actionable metrics, such as click throughs to your website and subscriptions to your email list. If people book tours on your website, then you want to use your social media posts to drive them there. Measure conversions to your website to see what works and what doesn’t to get people clicking on your website link.
If you are paying for Facebook boosts or doing other paid social campaigns, here are some key metrics that you should understand:
Cost Per Impressions (CPM) is the easiest and most common way to measure the rate you would pay for an online banner ad campaign. It is essentially how many times an ad is seen divided by the total cost of the campaign.
Cost Per Click (CPC) is also self-explanatory. It essentially means the total cost of campaign divided by the number of clicks. CPC can also be referred to as PPC (Pay Per Click).
Click Through Rate (CTR) is the % of people that see your ad (the impressions) and then click through to your site. This is one of the most important metrics if your goal is to drive people from the campaign to your website.
Ultimately, the most important number is the Cost Per Acquisition (CPA). This is basically measuring how much money you have to spend to get a paying customer. Getting customers is the entire point of your campaign, so of course, this is the most important measurement. Usually a company will have a “CPA target” which every campaign must come in under to make it worthwhile. It is also often used when when measuring payments for an affiliate.
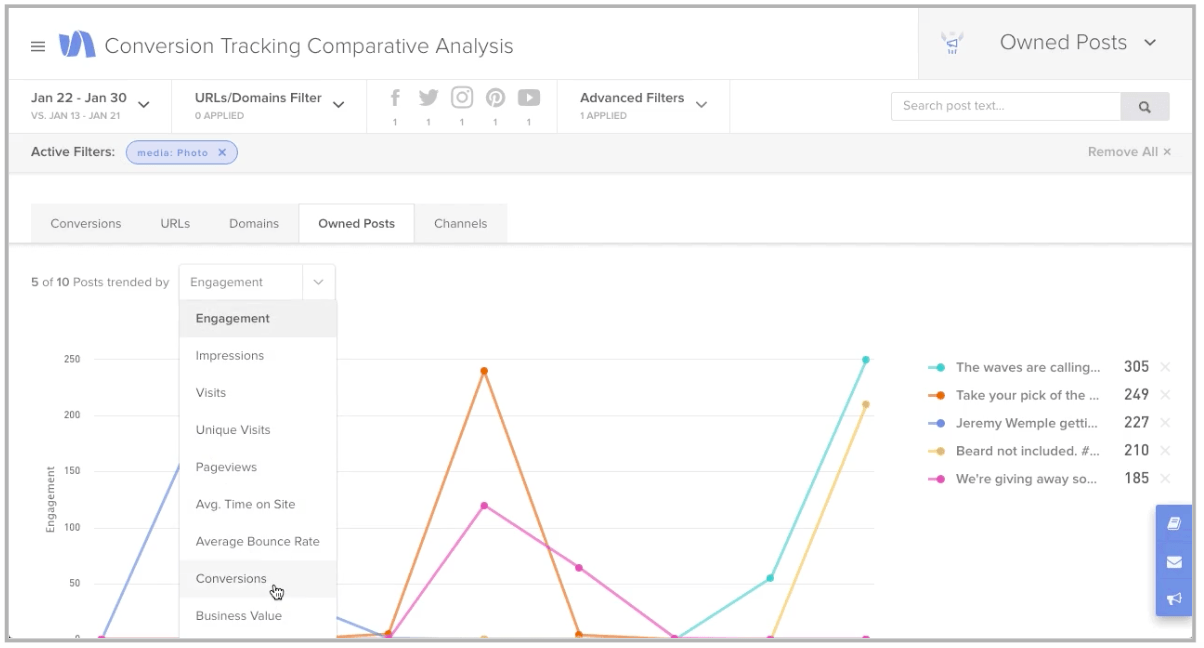
Ideally, you should be measuring which posts and campaigns lead to sales. If you want a software that can do this for you in an easy way, try using SimplyMeasured. (Update: SimplyMesaured has been acquired by SproutSocial. The measuring tools remain similar, so the text below is relevant. Read more about SproutSocial here(opens in a new tab).)
SimplyMeasured offer[ed] conversion tracking that is easy to understand. It’ll tell you which conversions and even purchases came from social media, and it’ll even do the math for you to show the total revenue that has come from social activity. You can also look at how each type of content compares, so you’ll be able to see what works best for your company. As I discussed in a recent blog post, Facebook Video will surely get you more impressions, but now you can see if your video content is actually getting you more leads and purchases.
This information will help you understand what is working for your tour company and where you should put your resources.
SimplyMeasured add[ed] another layer to your analysis by comparing your data to your competitors so you can see your performance in context and learn what works for others in your business.
I hope this information will help ease you into the complicated world of data analytics. Your analysis should have an impact on your marketing and business strategies. Report the data to your team and give them data-driven recommendations. Decisions should be based on data, and it will be easier than you think to get started.
Find this article useful? Enter your details below to receive your FREE copy of 95 Epic Places To List Your Tours and receive regular updates from Tourism Tiger and leading industry experts.
By submitting this form you agree to Tourism Tiger contacting you via email.